Data Visualization - D3.js Project
Language: Html / JavaScript
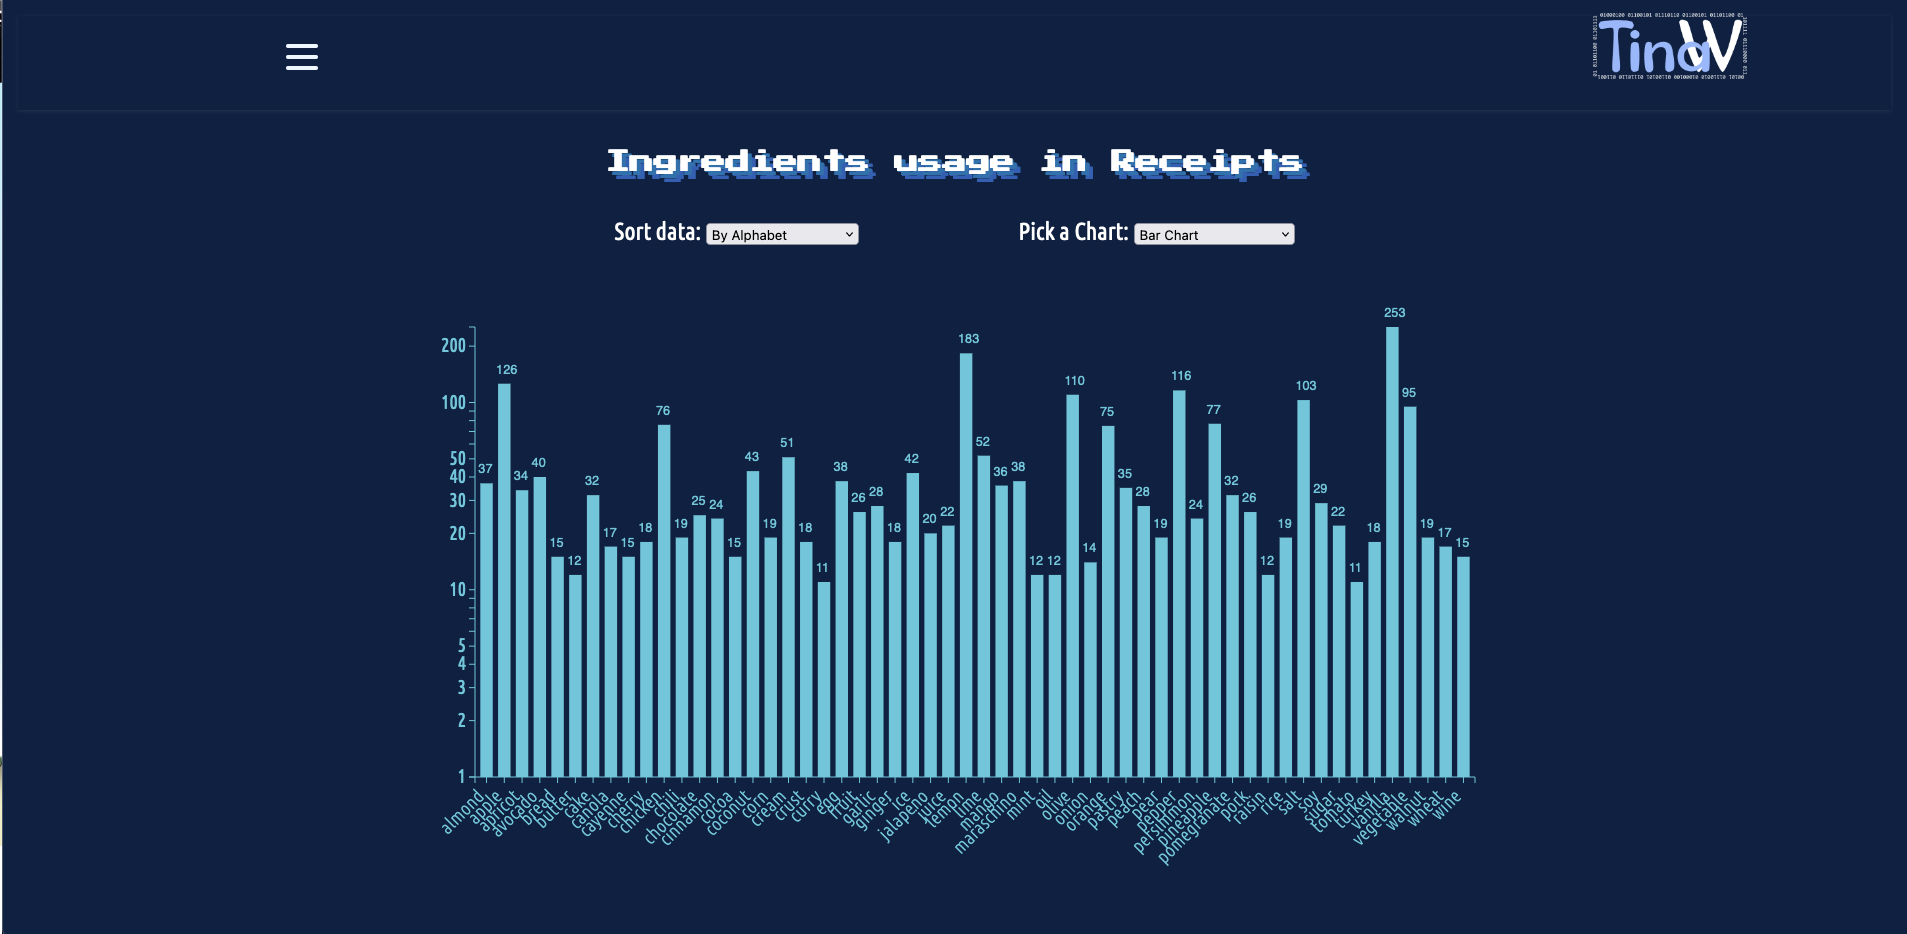
Description: Data Visualization - D3.js Project is an impressive project that demonstrates how to use D3.js, a popular JavaScript tool for data visualization. The project is built using HTML and JavaScript programming languages and converts a JSON file containing word frequency data into interactive charts. The project is designed to be user-friendly and easy to navigate. It includes various charts, such as bar charts and line charts, that display the word frequency data in a visually appealing way. The charts are interactive, allowing users to hover over them to see more detailed information or click on them to access further analysis. One of the key features of the Data Visualization - D3.js Project is its ability to showcase the power of D3.js for data visualization. The project demonstrates how to use D3.js to read a JSON file, process the data, and create various charts that can be customized to suit the user's needs. Overall, the Data Visualization - D3.js Project is an excellent project that showcases the team's skills in HTML and JavaScript programming languages and their creativity in utilizing D3.js for data visualization. Whether you're a data analyst looking for a powerful tool to visualize your data or a curious individual interested in learning more about D3.js, this project is an excellent resource for you.
Link: /project/data_visualization/d3-project.html
Type: frontend